
Financial Highlights
Sales and Profit/Loss
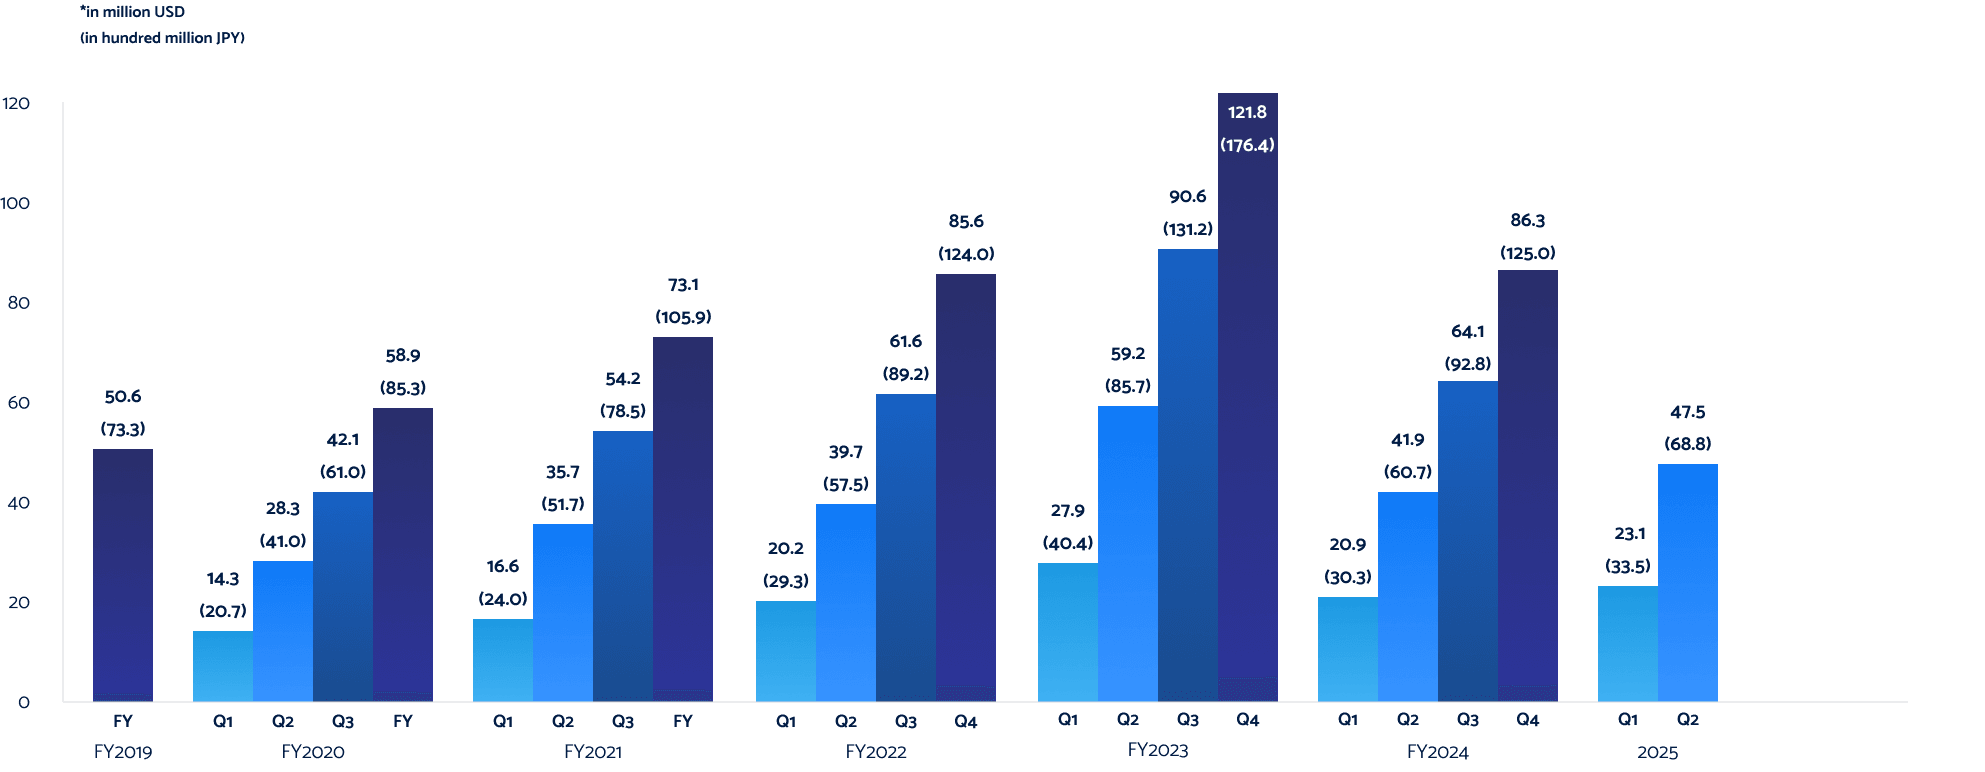
Revenue
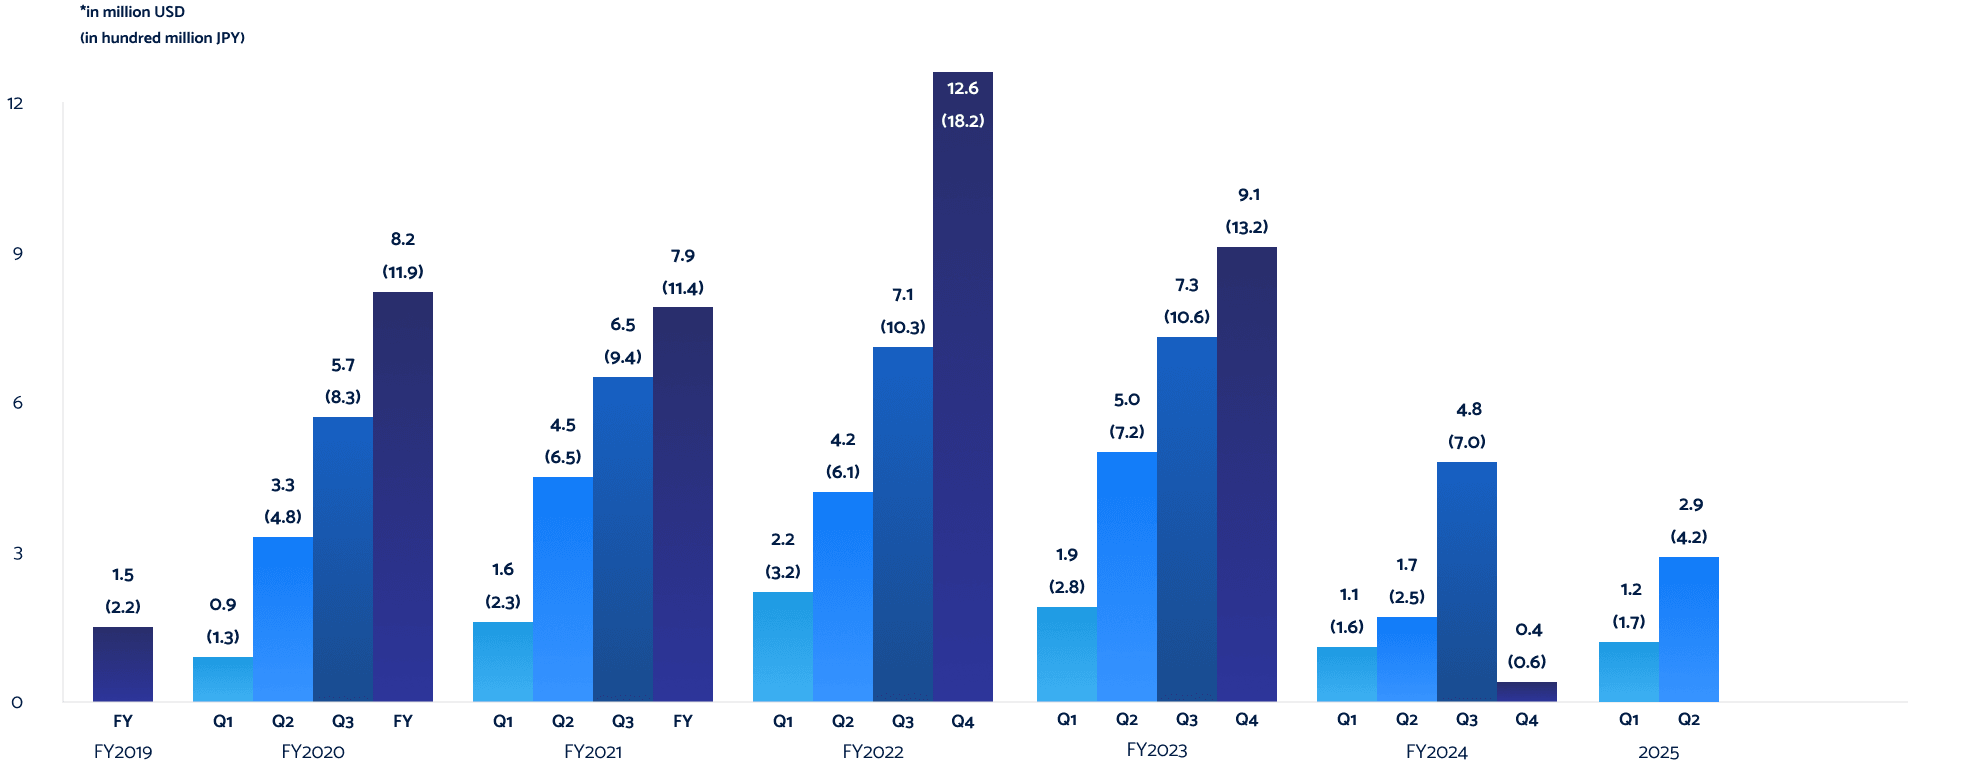
Operating Profit/(Loss)
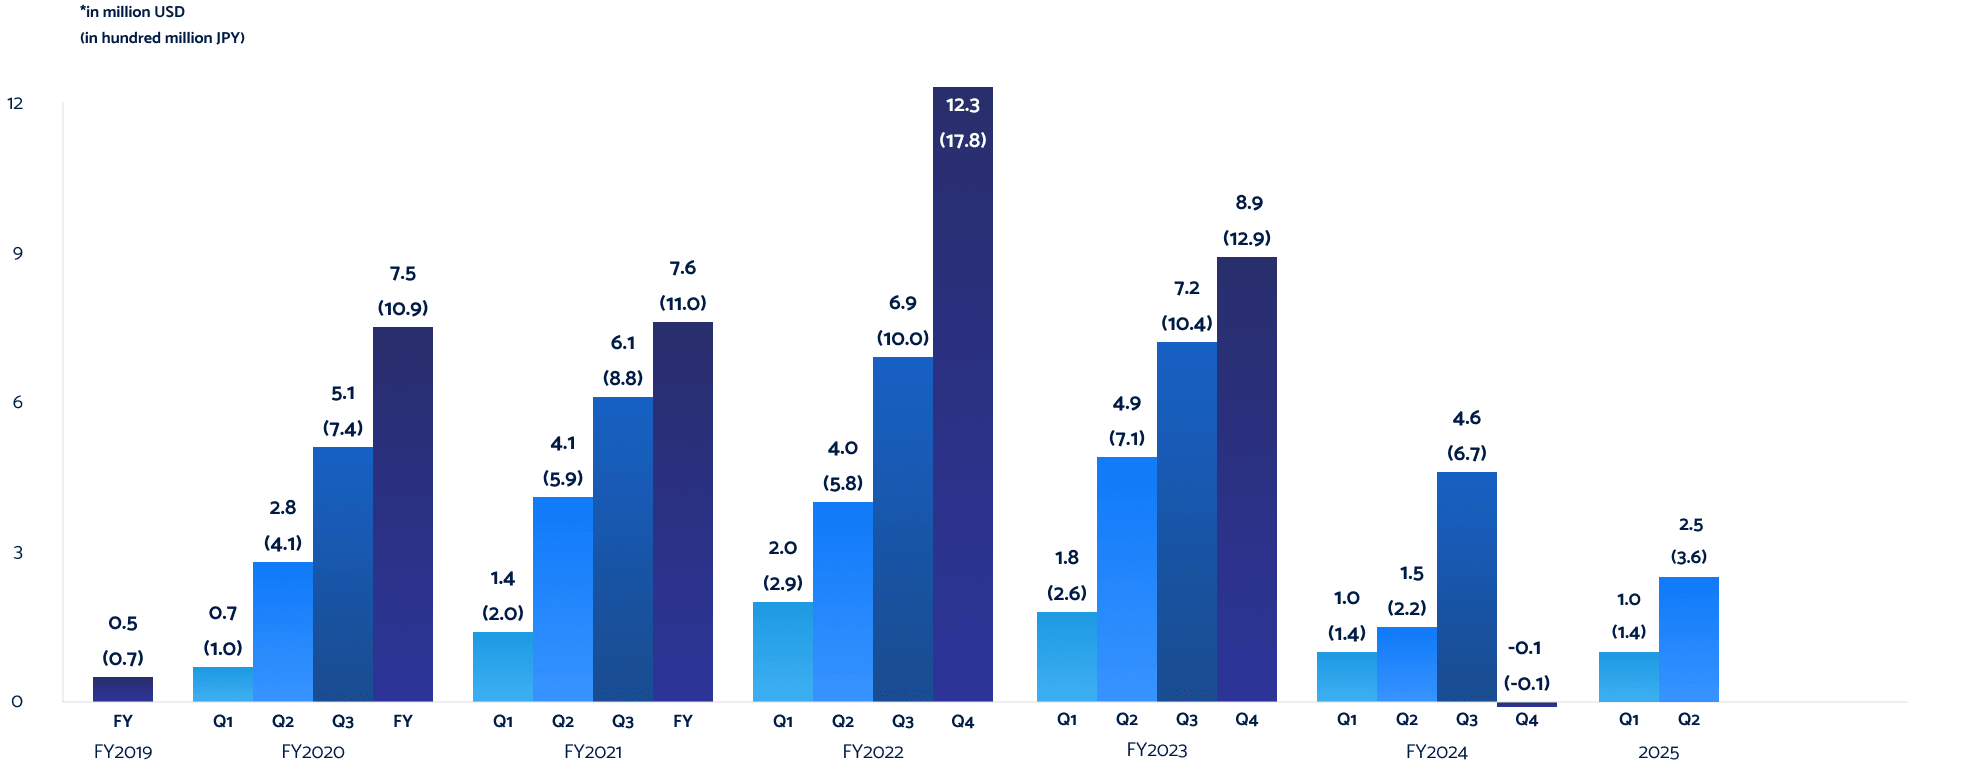
Profit/(Loss) Before Tax
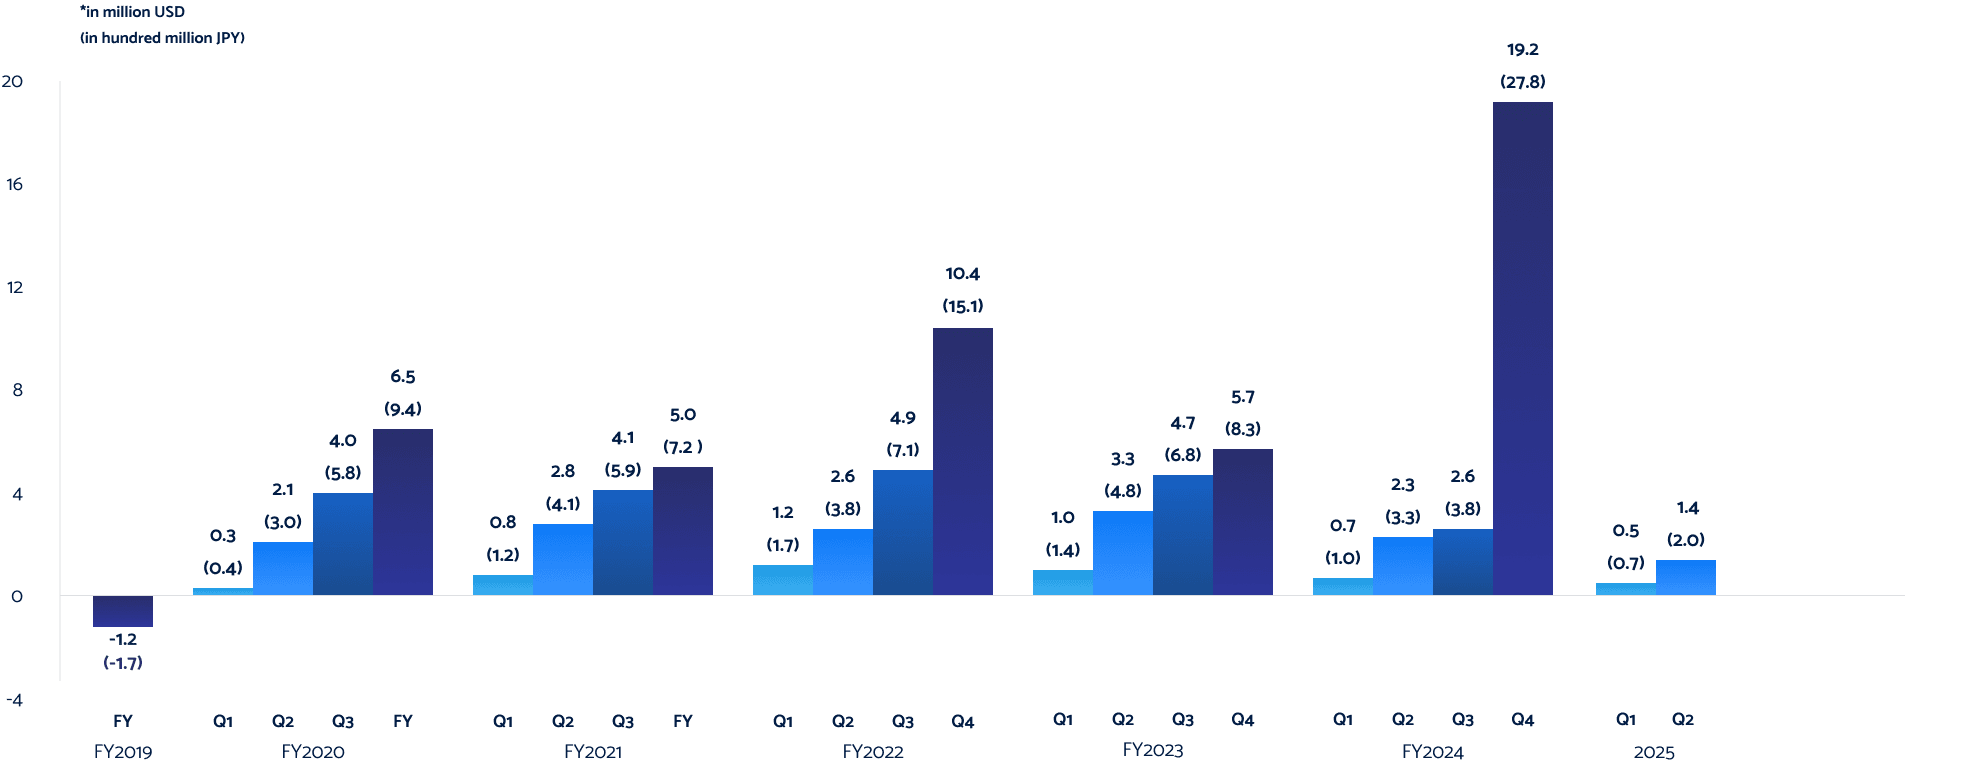
Profit/(Loss) for the Period
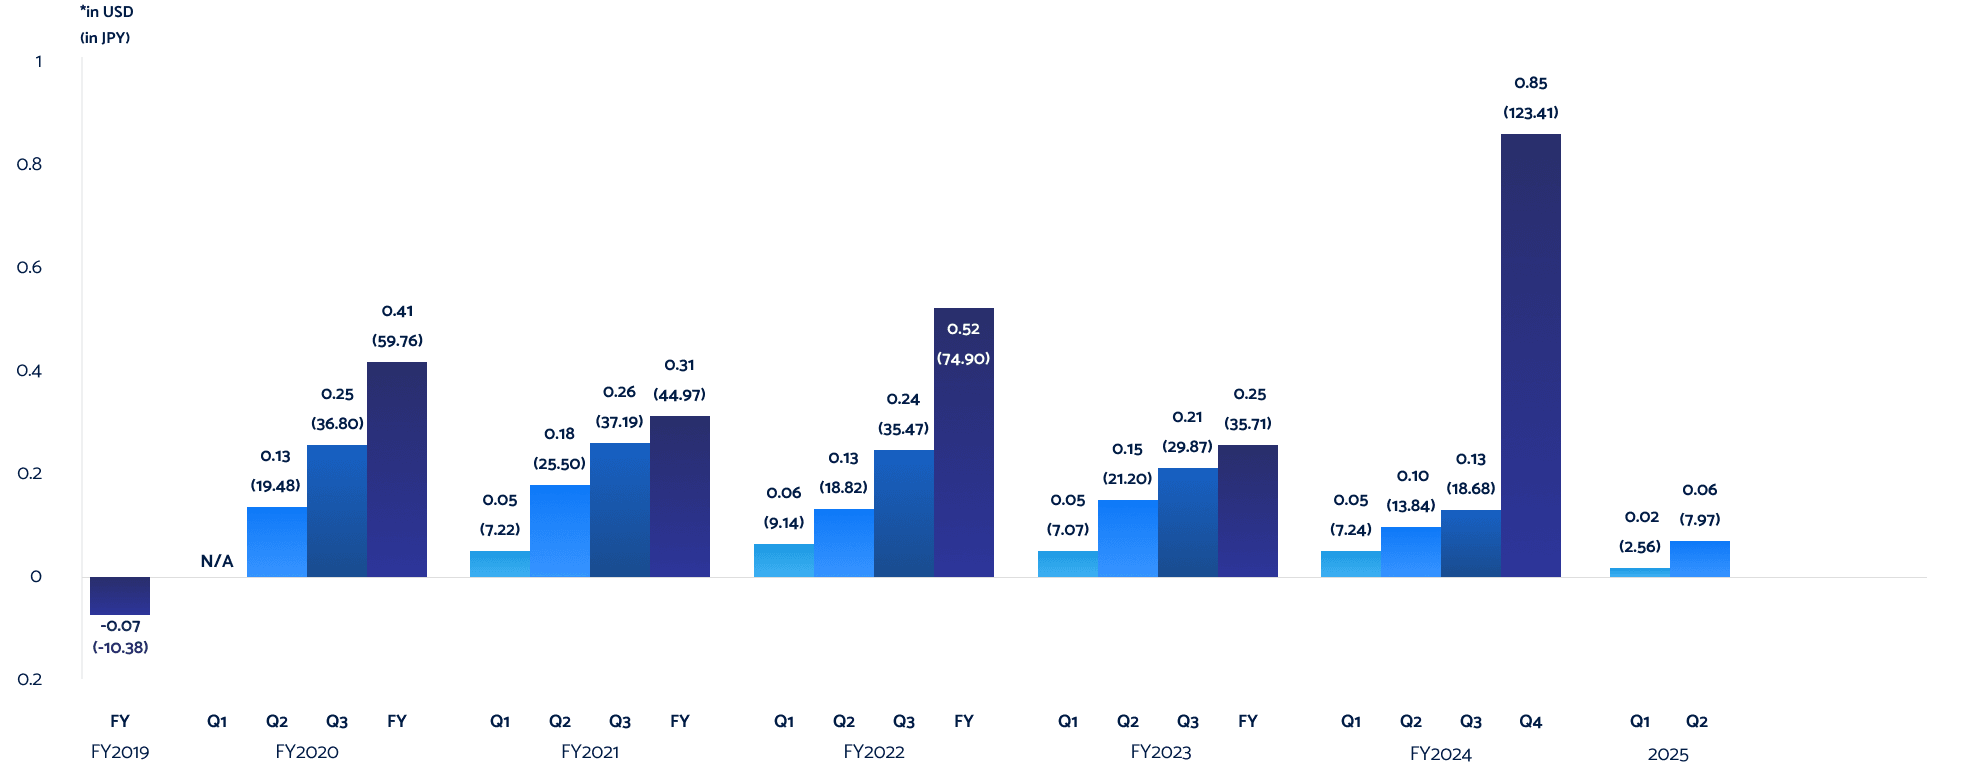
Basic Earnings/(Loss) per Share
Assets
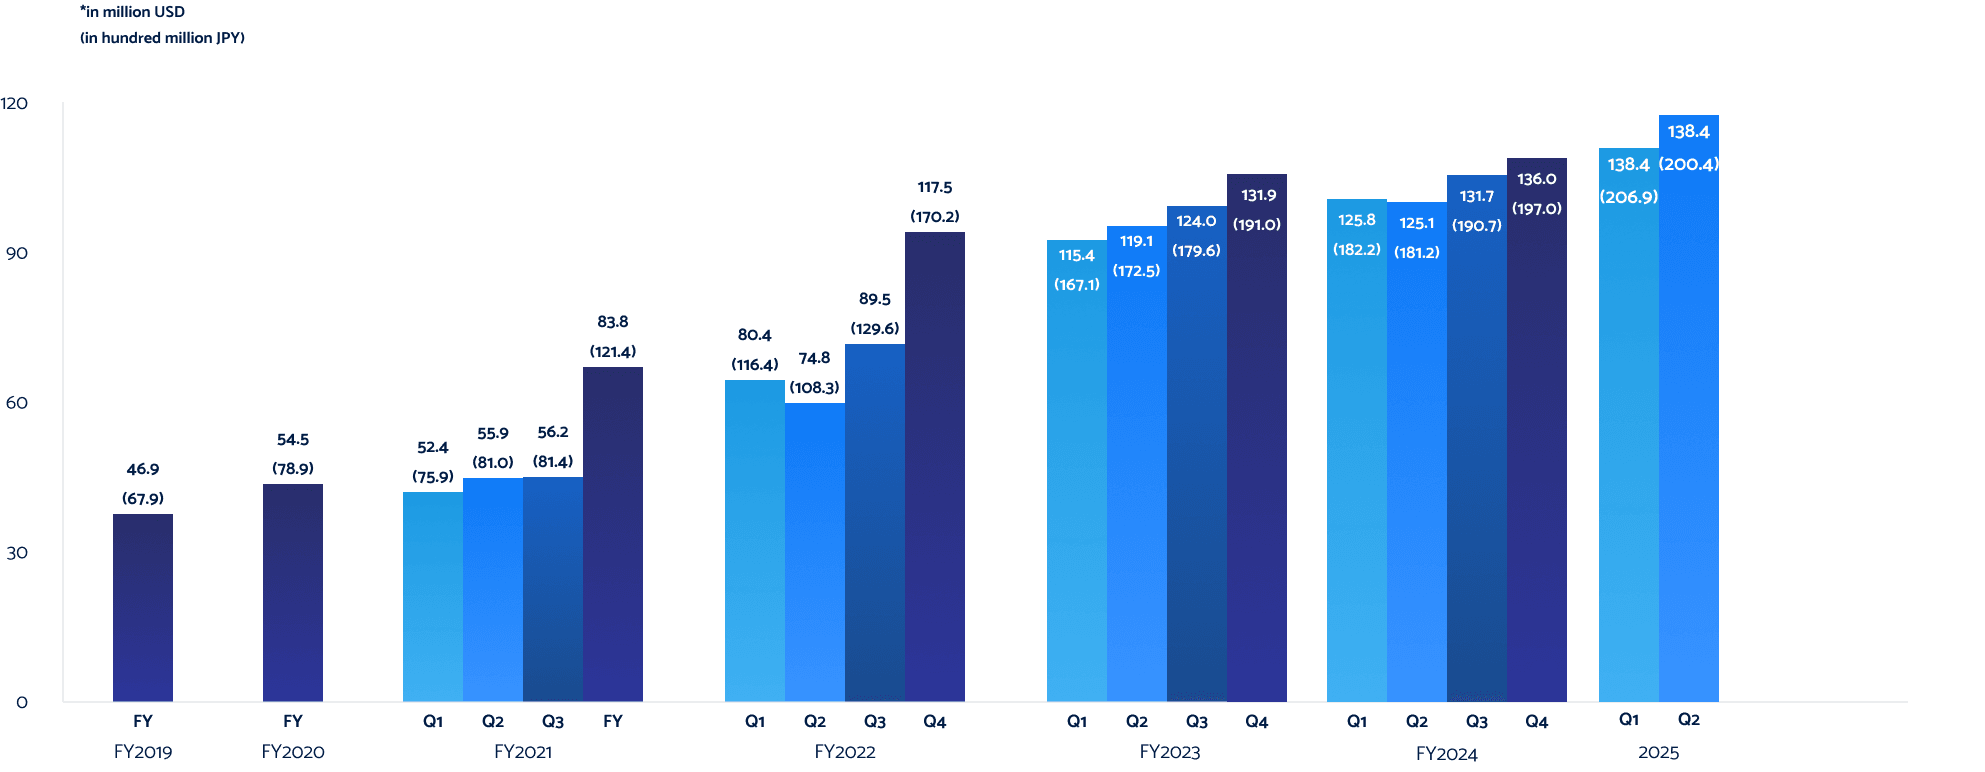
Total Assets
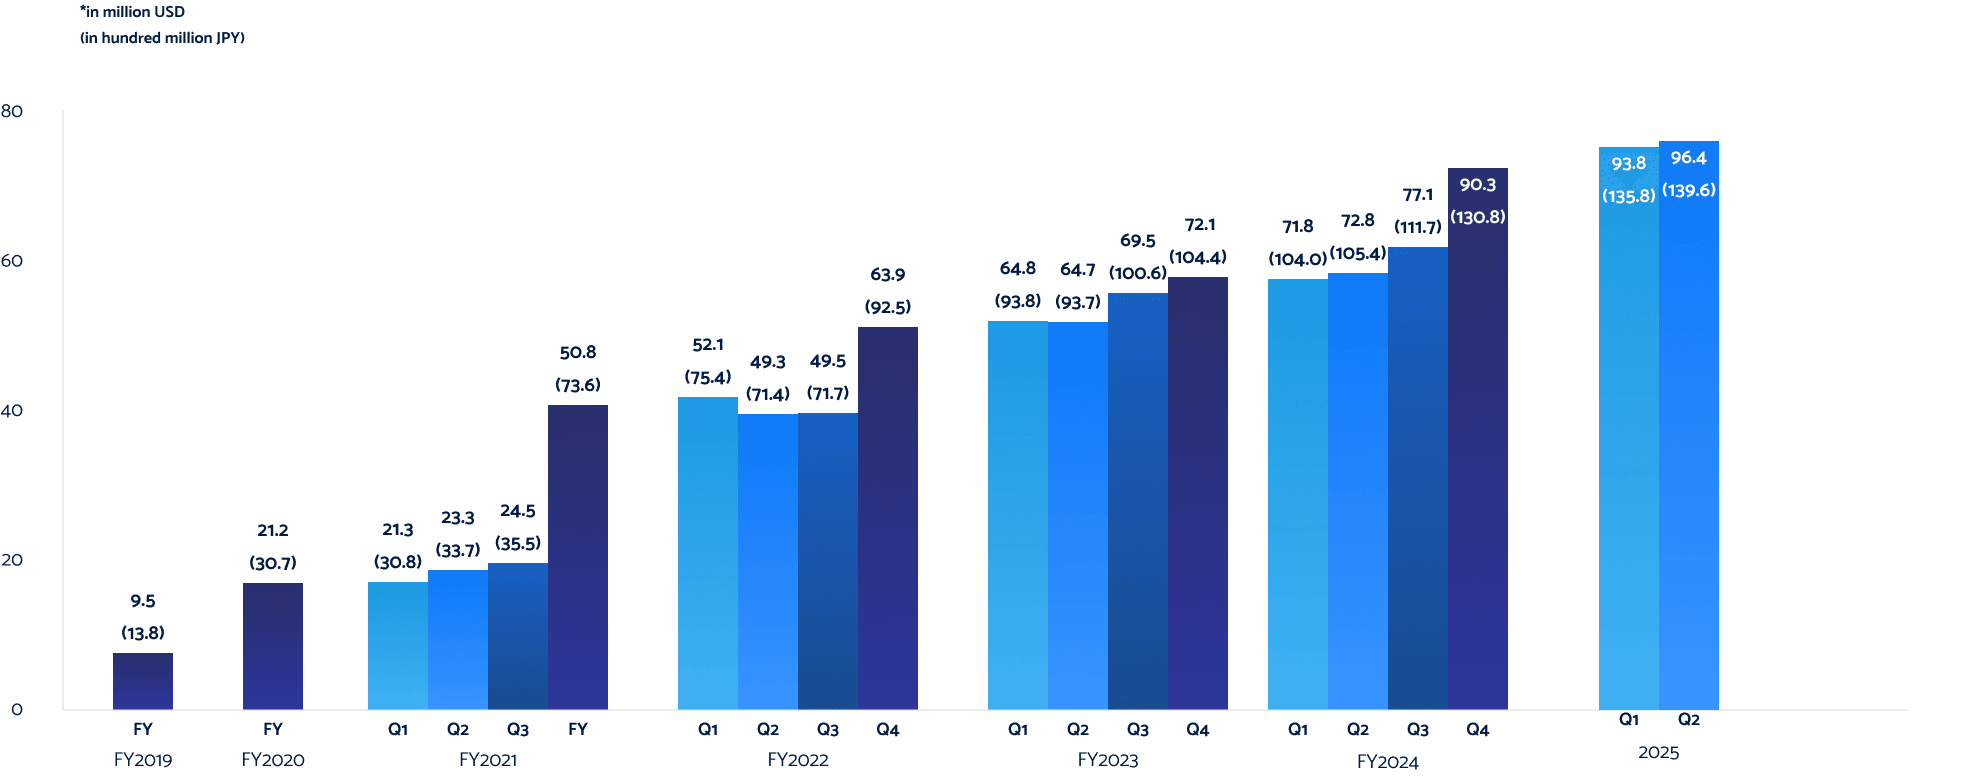
Net Assets
Financial Highlights
| FY2019 | FY2020/Q1 | FY2020/Q2 | FY2020/Q3 | FY2020 | FY2021/Q1 | FY2021/Q2 | FY2021/Q3 | FY2021 | FY2022/Q1 | FY2022/Q2 | FY2022/Q3 | FY2022/Q4 | FY2023/Q1 | FY2023/Q2 | FY2023/Q3 | FY2023/Q4 | FY2024/Q1 | FY2024/Q2 | FY2024/Q3 | FY2024/Q4 | FY2025/Q1 | FY2025/Q2 | ||
| Revenue | in million USD | 50.6 | 14.3 | 28.3 | 42.1 | 58.9 | 16.6 | 35.7 | 54.2 | 73.1 | 20.2 | 39.7 | 61.6 | 85.6 | 27.9 | 59.2 | 90.6 | 121.8 | 20.9 | 41.9 | 64.1 | 86.3 | 23.1 | 47.5 |
| in hundred million JPY | 73.3 | 20.7 | 41.0 | 61.0 | 85.3 | 24.0 | 51.7 | 78.5 | 105.9 | 29.3 | 57.5 | 89.2 | 124.0 | 40.4 | 85.7 | 131.2 | 176.4 | 30.3 | 60.7 | 92.8 | 125.0 | 33.5 | 68.8 | |
| Operating Profit/(Loss) | in million USD | 1.5 | 0.9 | 3.3 | 5.7 | 8.2 | 1.6 | 4.5 | 6.5 | 7.9 | 2.2 | 4.2 | 7.1 | 12.6 | 1.9 | 5.0 | 7.3 | 9.1 | 1.1 | 1.7 | 4.8 | 0.4 | 1.2 | 2.9 |
| in hundred million JPY | 2.2 | 1.3 | 4.8 | 8.3 | 11.9 | 2.3 | 6.5 | 9.4 | 11.4 | 3.2 | 6.1 | 10.3 | 18.2 | 2.8 | 7.2 | 10.6 | 13.2 | 1.6 | 2.5 | 7.0 | 0.6 | 1.7 | 4.2 | |
| Profit/(Loss) Before Tax | in million USD | 0.5 | 0.7 | 2.8 | 5.1 | 7.5 | 1.4 | 4.1 | 6.1 | 7.6 | 2.0 | 4.0 | 6.9 | 12.3 | 1.8 | 4.9 | 7.2 | 8.9 | 1.0 | 1.5 | 4.6 | -0.1 | 1.0 | 2.5 |
| in hundred million JPY | 0.7 | 1.0 | 4.1 | 7.4 | 10.9 | 2.0 | 5.9 | 8.8 | 11.0 | 2.9 | 5.8 | 10.0 | 17.8 | 2.6 | 7.1 | 10.4 | 12.9 | 1.4 | 2.2 | 6.7 | -0.1 | 1.4 | 3.6 | |
| Profit/(Loss) for the Period | in million USD | -1.2 | 0.3 | 2.1 | 4.0 | 6.5 | 0.8 | 2.8 | 4.1 | 5.0 | 1.2 | 2.6 | 4.9 | 10.4 | 1.0 | 3.3 | 4.7 | 5.7 | 0.7 | 2.3 | 2.6 | 19.2 | 0.5 | 1.4 |
| in hundred million JPY | -1.7 | 0.4 | 3.0 | 5.8 | 9.4 | 1.2 | 4.1 | 5.9 | 7.2 | 1.7 | 3.8 | 7.1 | 15.1 | 1.4 | 4.8 | 6.8 | 8.3 | 1.0 | 3.3 | 3.8 | 27.8 | 0.7 | 2.0 | |
| Basic Earnings/(Loss) per Share |
in USD | -0.07 | - | 0.13 | 0.25 | 0.41 | 0.05 | 0.18 | 0.26 | 0.31 | 0.06 | 0.13 | 0.24 | 0.52 | 0.05 | 0.15 | 0.21 | 0.25 | 0.05 | 0.10 | 0.13 | 0.85 | 0.02 | 0.06 |
| in JPY | -10.48 | - | 19.48 | 36.80 | 59.76 | 7.22 | 25.50 | 37.19 | 44.97 | 9.14 | 18.82 | 35.47 | 74.90 | 7.17 | 21.49 | 30.28 | 36.80 | 7.24 | 13.84 | 18.68 | 123.41 | 2.56 | 7.97 | |
| Total Assets | in million USD | 46.9 | - | - | - | 54.5 | 52.4 | 55.9 | 56.2 | 83.8 | 80.4 | 74.8 | 89.5 | 117.5 | 115.4 | 119.1 | 124.0 | 131.9 | 125.8 | 125.1 | 131.7 | 136.0 | 138.4 | 146.8 |
| in hundred million JPY | 67.9 | - | - | - | 78.9 | 75.9 | 81.0 | 81.4 | 121.4 | 116.4 | 108.3 | 129.6 | 170.2 | 167.1 | 172.5 | 179.6 | 191.0 | 182.2 | 181.2 | 190.7 | 197.0 | 200.4 | 212.6 | |
| Net Assets | in million USD | 9.5 | - | - | - | 21.2 | 21.3 | 23.3 | 24.5 | 50.8 | 52.1 | 49.3 | 49.5 | 63.9 | 64.8 | 64.7 | 69.5 | 72.1 | 71.8 | 72.8 | 77.1 | 90.3 | 93.8 | 96.4 |
| in hundred million JPY | 13.8 | - | - | - | 30.7 | 30.8 | 33.7 | 35.5 | 73.6 | 75.4 | 71.4 | 71.7 | 92.5 | 93.8 | 93.7 | 100.6 | 104.4 | 104.0 | 105.4 | 111.7 | 130.8 | 135.8 | 139.6 |
Caution
- In the event that a correction to the financial statements is announced, the information contained in this data will not be reflected immediately.
- The results of SOLIA, Inc. are excluded from the results of the Principal Investments from FY2023 onwards.
- Some indicators may be updated only for the annual figures due to changes in the format of the financial reports.
- Telegraphic Transfer Middle Rate (TTM) of Mizuho Bank dated June 30, 2025 (latest quarter period ending) of 1 USD = 144.82 JPY is used for conversion on this website.
Sign up for our Investor Relations Newsletter
Get the latest YCP Holdings recent investor-related reports and corporate updates delivered right to your inbox.
We care about the protection of your data. Read our Privacy Policy.